Are D&D Sales Declining?

In all other RPGs and D&D editions, we see diminishing returns. Each follow-up supplement, adventure, or other product will sell fewer copies and have a shorter tail than the first ones. Is 5E D&D seeing declining sales?
We are again looking at the BookScan data, and it is worth repeating:
BookScan data is normally available only to invited book publishers. BookScan tracks the sales of all books sold in the US to big box stores. It excludes direct sales, digital sales, gaming stores, and comic book stores. It includes Amazon, though Amazon in some years (especially during the pandemic) provided either no data or partial data out of worries that it disclosed too much about Amazon sales.
A UCLA study estimated that BookScan may account for 75% of all retail sales. The amount for D&D is likely much lower, because of the importance of gaming stores and other sales venues for RPGs. More on the likely percentage next time!
I have heard that at least in the UK BookScan did not report any sales for 17 weeks in 2020. This was because Amazon’s share of the BookScan sales became so significant when brick and mortar retailers closed (due to the pandemic) that it would have essentially exposed Amazon’s sales data. Because of this, any “first x” columns for books releasing in 2020 (especially Spring and Summer 2020) may be understated. More on this later.
Declining Sales are Normal
It’s important to be clear: we should expect a 10-year-old edition to see declining sales. All RPGs contend with this problem. Here is one of my favorite graphs on the subject, from Ben Riggs. It shows a series of 1E and 2E monster products. Each one has a shorter “tail” of sales than the previous one, quickly spiraling into very low sales. (As with all charts in this post, click to see a larger version.)

The above graph is what most RPGs have looked like for the history of our hobby. Fans tell you they love your RPG’s monster manual and want more monsters. If you are a small company, you borrow money to release a second book and it might lead to an initial surge of sales before quickly fading. Eventually, you aren’t making profit and you may be in debt. The only solution is to release a new edition (or close shop). This isn’t just a 1E or 2E issue. It happened to 3E, even with core books. The 3E PH started declining. The release of the 3.5 PH brought sales back up, but even more quickly they declined again. 4E saw this as well with iterative releases such as Martial Power 2 and even when the products were much better, such as the Nentir Vale monster book.
We do have a small example from Ben Riggs pertaining to 2E adventures, showing the same fate for Dark Sun adventures:
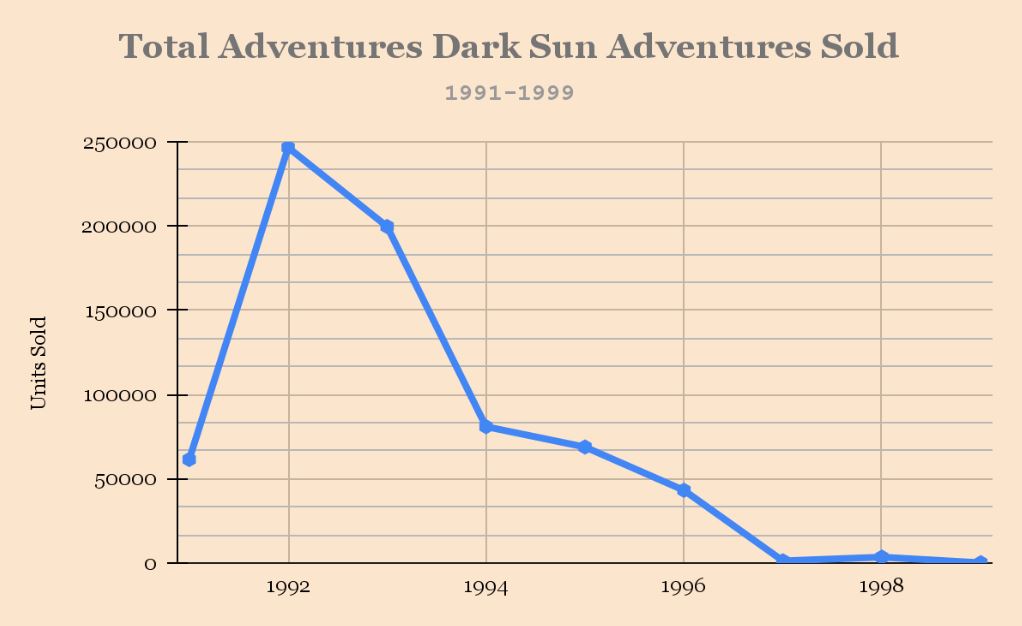
That is a dismal picture. Is 5E suffering the same fate? Given RPG history, if the 10-year 5E is NOT seeing significant declines it would be a huge surprise for D&D and the industry. If you have been listening to Mastering Dungeons, you have heard guests and us share that the designers creating 5E were not sure whether 5E would be successful. There was no reason to suspect a different fate than what the industry had seen over and over again.
5E’s Sales Over Time
Here we have a graph created on the my Patreon Discord, showing the 52 week to 4 week ratio, as a way to capture whether adventures are slowing over time.

In the above graph, the sales a product had in weeks 1-4 are compared to the sales in weeks 5-52. Products prior to Mad Mage in 2018 had roughly double the sales they had in weeks 1-4. After that point, the sales in weeks 5-52 are closer to equal the sales in the initial 4 weeks. This shows sales are slowing.
Various other charts shared on our Discord show support for the strength of sales for Dragon Heist and Strahd (both versions). The old anthologies of Yawning Portal, Saltmarsh, and Candlekeep are solid performers. Of recent products, most releases are having very strong starts with only the few exceptions we have noted (Radiant Citadel, Netherdeep).
This next chart looks at the first 8 weeks of sales by date. It is mainly adventures, with a couple of setting books.
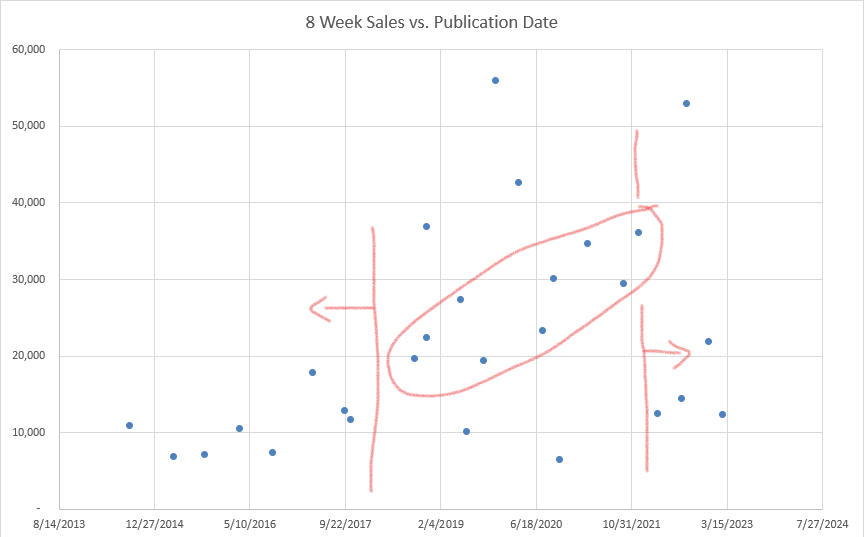
The graph suggests three eras. In 2014-2017, 5E is warming up (okay, historically, it is on fire; relative to the rest of 5E, it is warming up). Yawning Portal has one of the strongest starts during this time, but nothing exceeds 18k sales in the first 8 weeks.
The second era, 2018-2021, sees almost everything exceed 18k in the first 8 weeks. The setting books (Ravnica, Eberron, Wildemount) are included here and are the three highest dots.
Finally, for the 2022 releases and first 2023 release, Spelljammer sees an astounding 52k sales, but then Dragonlance is 21k and everything else is below the second era. It is hard to know for sure what this era looks like and why. The OGL seems to have had no measurable impact on sales, while the D&D movie clearly pushed sales upward right around its marketing and release. It is hard to say whether the One D&D announcement and playtesting has hurt sales. It’s possible, but we don’t see anything clear in the data. Most of the 2023 releases came after July, so we don’t have BookScan data (unless someone chooses to share that) to see whether 2023 is truly a down year.
Here is another way we can look at the BookScan data to try to answer whether D&D 5E is seeing declining sales. We can look at the first 12 weeks of sales for all adventures each year, both the total and the average per book. I ignored 2023 since the data only covers one book.

We can see that the average climbs, slows, climbs again, and then drops between 2021 and 2022. The total continues to climb.
For comparison, here is the first year (52 weeks) of each release.
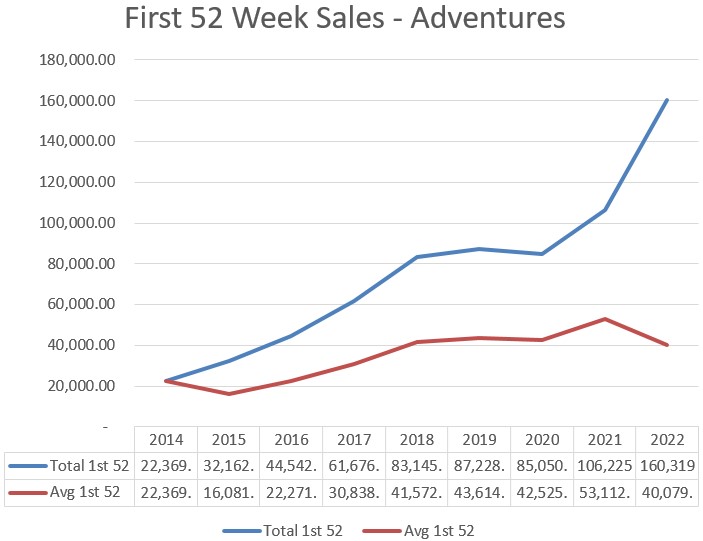
We can see similar graphs with the first 52 weeks of product sales. The 2021-2022 shows sales per average product are slowing, though total sales for the new products that year are higher. This is lower profit per book, but still growth across the adventure line. Now, don’t take these number or lines as absolute, given their BookScan origins. It likely holds across the whole of sales venues but we can’t be sure and the exact numbers and angle of lines could vary.
If 5E is declining, it is not doing so the way previous editions did, which was typically a precipitous drop for every release, faster than ever before. And, when we combine sales, individual years look strong. 2022 is not a bad year for D&D in terms of total sales, though it may be lower sales per product. That is very different from previous editions.
Decline for All Products?
And, hey, why not. Let’s look at all 5E D&D products, not just adventures, and see if we see the same trends. Let’s look at three charts that show how all products did in their first 4, 12, and 52 weeks. The fourth chart combines all the data into one chart.

This is different than for just adventures. We can see that average sales per product (the bottom line in the individual charts) are generally trending upwards and then dropping starting in 2020. This bottom line resembles what we saw for average adventure sales.
When we look at the total of all products in a year, however, the total sales for each year are also slowing. Unlike the data for total adventures, which were increasing, the total sales for all D&D products seem to be slowing.
Reminder: BookScan data is just part of the data. And, overall the total numbers are absolutely amazing compared to what anyone would have expected from a D&D edition after 10 years. While we seem to see diminishing returns, these numbers are still fantastic for our hobby. And, a reminder that 2020 is when Amazon may have reported partial or no data, and BookScan/Nielsen filled in the data based on estimates. However, it is believed the 2021 and 2022 data should include accurate Amazon numbers.
What This Indicates
D&D is slowing. The decline isn’t disastrous like our hobby typically experiences. That is an accomplishment. RPG companies other than WotC would likely celebrate these results, let alone the continued sales volumes 5E is displaying.
Nonetheless, if D&D is going to be a $1B brand, it won’t be doing so solely with printed RPG products. Solely increasing the pace of releases won’t achieve massive growth, and may be hurting growth (we don’t know). D&D’s changing strategies don’t seem to be resulting in the desired effect (but, we can’t be sure… perhaps they are slowing decline).
If this data is representative of the larger sales, which it probably is, then we can see why D&D is exploring many different ways to sell products. A $5 D&D Beyond monster supplement. An increased focus on direct sales. Shifting from third-party distributor Penguin Random House to Hasbro distribution. New onramps to draw D&D Beyond subscriptions. Marketing playing off of the Baldur’s Gate 3 video game. A 2024 revamp. And increasing profit through fewer pages, larger fonts, and higher prices.
Next, one final article. We can’t determine what percentage of D&D sales the BookScan data represents… or can we?

7 comments on “Are D&D Sales Declining?”
Leave a Reply
Support This Site

 Mastodon
Interesting data.
I wonder, to what extent is the data impacted by the number of books released in each year. The years the stand out as low points here are 2018 (5 books), 2021 (5 books), and 2022 (6 books), which are also the years with the most books released in them.
I’d also be curious to see how well the total sales of the core rules (PH, DMG, MM) correlate with the yearly sales over time. If the total sales of the core rules can be used as a proxy for the size of the D&D player base, then I might expect them to correlate well.
Lastly, a new, and possibly big wrench in this kind of analysis is the impact that digital purchases have had on physical book sales. Access to digital book options has ramped up a lot over the last several years. So, it could be having an impact, at least in principle. How much, though, is anyone’s guess outside of WotC.
Excellent thoughts, Tom! I don’t have data on this, but what I hear and see suggests that the 5E market is big enough that it isn’t predicated solely on hardcore fans who are buying every release. Just as more than half of all 5E players started with 5E, my belief from what I hear is that a lot of purchases come from people who buy on impulse or are pretty new to the game. This means that publishing 5 or 8 books in a year may tire a hardcore gamer, but may present more opportunities for the bulk of the audience to find something they like. On adventures, the data seems to back this up. We see overall sales climb, while average sales per book decline. But across all product types, the total sales are also declining for new releases. The long tail of core books and earlier releases may overcome this (and probably do so currently), but it currently appears that each new release is going to earn less. That’s a problem, eventually.
Digital purchases are a huge unknown. My feeling from what I hear is that this is still a small part of the pie. But it could change and maybe already has. But the first real digital push to a broader audience was Dragonlance and I don’t hear it is doing particularly well in any format, digital or print. Wizards certainly seems to have moved on from Dragonlance and you practically never hear it mentioned. I suspect digital sales bolster profitability but don’t represent a large new segment of sales… yet.
Yet. Hasbro is going to push people hard in this direction. They’ve ended thier deal with Penguin/RH and it seems pretty clear that the people in charge of WotC would stop printing physical books altogether if they thought they could get away with it.
Knowing various folks at Wizards, I believe the intent of considering digital over print is in several areas. First, if and only if the audience sees this as an interest area – otherwise, you are hurting your market. Second, the appeal is that of behaving more like a video game or online content provider, where you can constantly update content and offer slices of content. Third, the ability to offer content in various ways that are profitable, such as through the VTT… one source of data, various more profitable outlets. Behind all of this is the core problem of our RPG hobby not being financially a good place to operate, so you seek changes (the same way Paizo invested heavily in a risky MMO).
The OGL debacle definitely affected sales. They don’t show up here because the people who buy D&D books at Target would have had no clue there was any sort of controversy. Digital sales were probably most affected but Hasbro obviously isn’t going to share any of thier numbers.
Can you share your statistics for the sales impact? I don’t have any statistics showing this.
The OGL Debacle was likely a blip in sales for a few reasons.
First, as you say, the people buying D&D books at Target or Amazon likely had no idea of the issue. The vast, vast majority of D&D players and buyers don’t use OGL or followed the news. And not all who learned the news cared.
D&D has millions of players while the most wildly successful 3PP might have less than 50k backers on Kickstarter.
Second, the reported cancellations were likely exaggerated. There were reports of 40-90,000 cancellations and the like. That it lost 70% of its subscribers. Except, there are a few million subscribers, so it might be 1-5% of subs. AND the 40-90k numbers were the number of reported tickets filed for that month. This would include mundane billing and account issues as well as tickets relayed to MtG Arena, which has 7 million users. The actual number of cancellations could be far, far smaller.
Lastly, even assuming the number of cancelled subs was accurate, this presumes a significant percentage did not re-subscribe following the end of the controversy. WotC only lost money if they weren’t paying during their next billing cycle, which could be 1-12 months after cancellation.
I unsubscribed at the time, but had been paying for a year and still had several months left. Well after the controversy and before my sub expired, I re-upped (to share purchased books with a new players at my game table), so the total revenue WotC lost from me was $0.